Prediction
NLSExplorer makes predictions based on input protein sequences. Note that you can input a FASTA file or directly paste the sequence into our input box. Ensure that your sequence does not contain any characters that do not represent amino acids. You can click the example to see the correct input format.
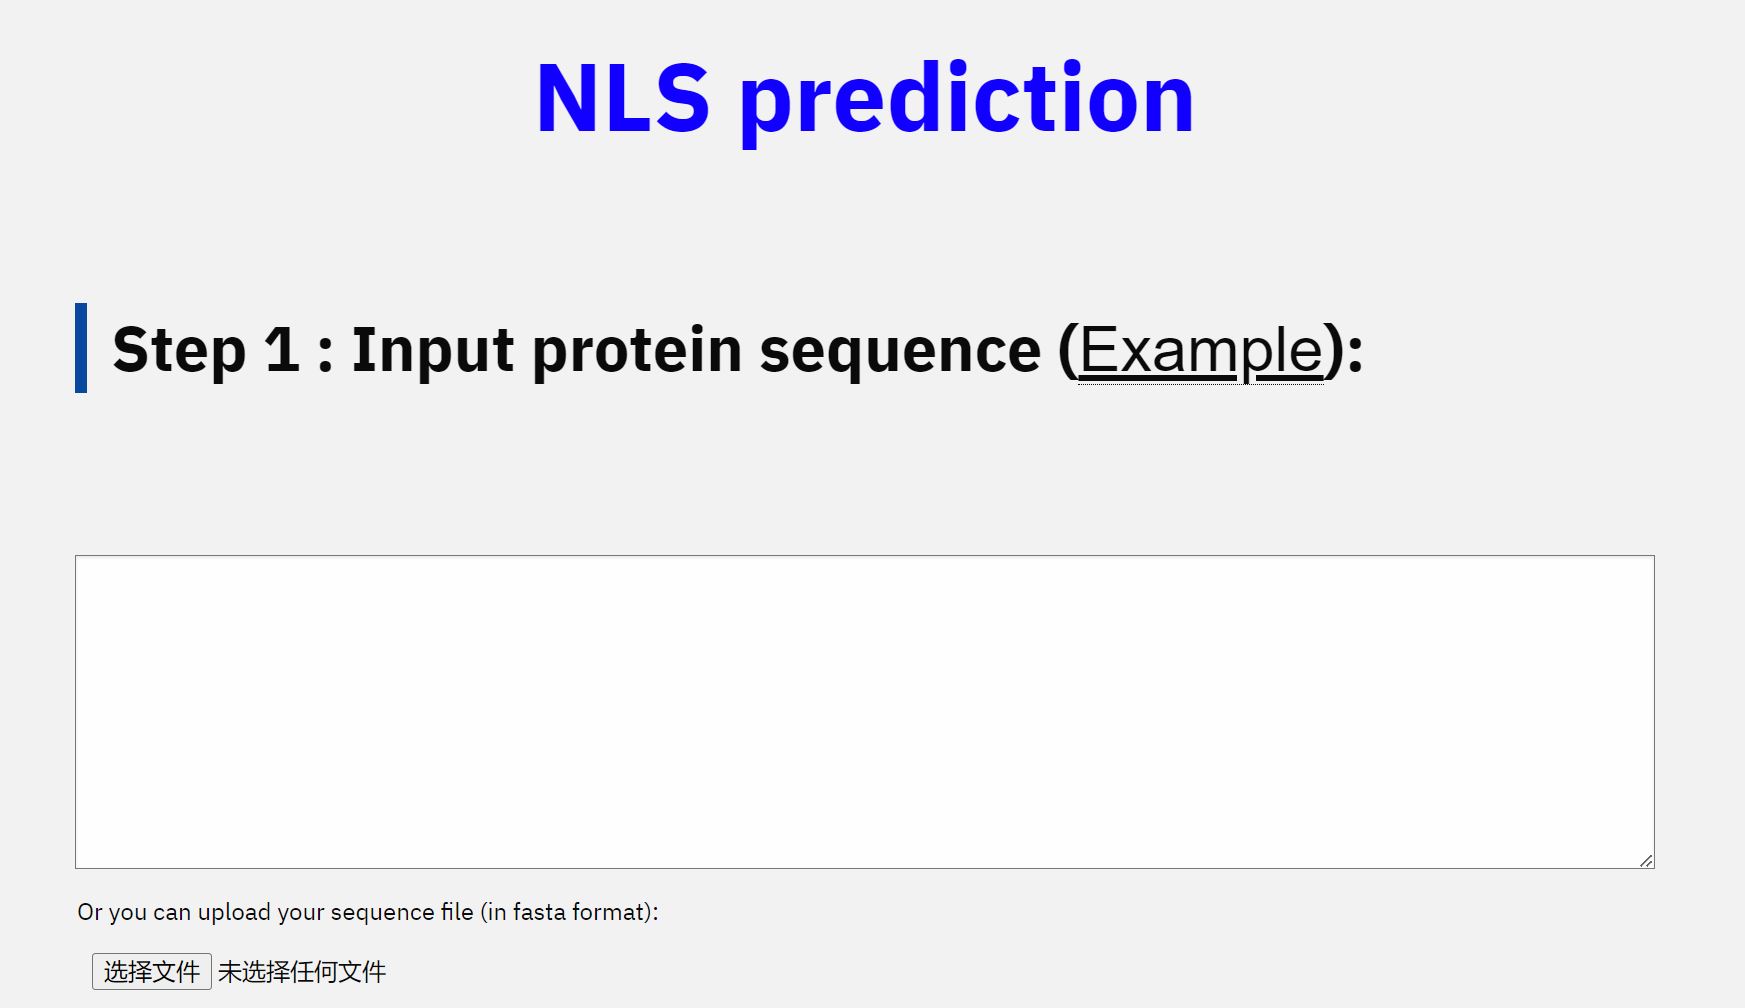
After a protein sequence is input, you can directly make a prediction, or you can further customize the prediction
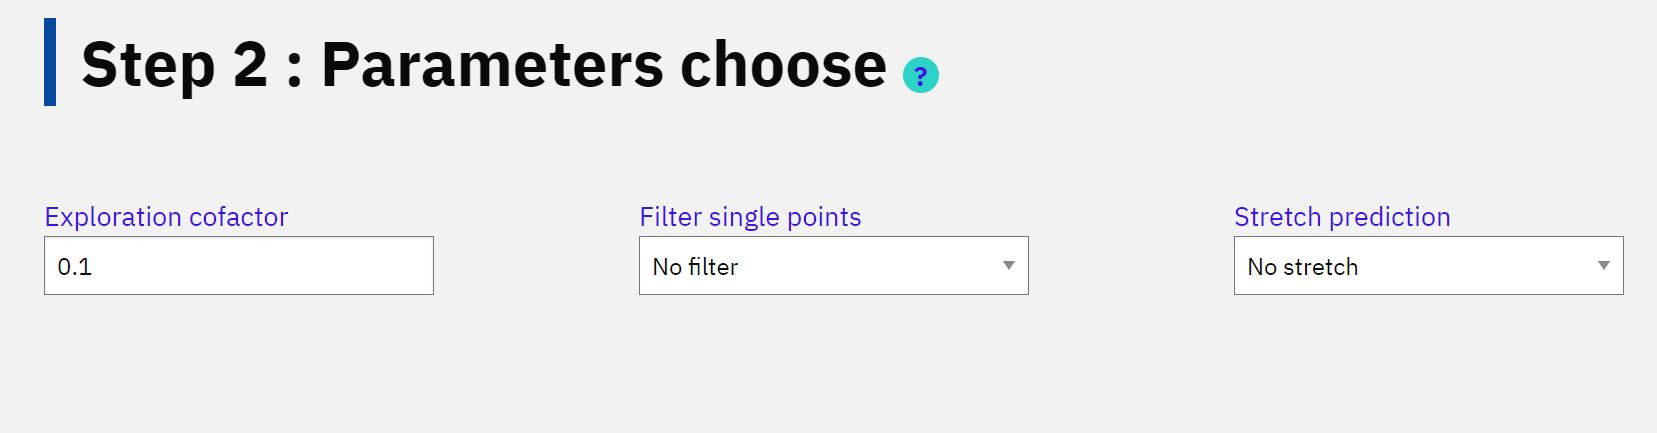
through three additional steps. The second step is to choose the parameters for NLSExplorer. There are three parameters that will
influence the prediction results: Exploration cofactor, Filter single residues, and Stretch prediction.
"Exploration cofactor": This parameter determines the proportion of the full length of a sequence that will be extracted to generate key segments.
A high value will increase the likelihood of detecting potential NLS, but it may also introduce noise. The default value is 0.1.
"Filter single residues": Filtering single residue means there exists single residue generated by A2KA with high attention weight.
The principle of A2KA is to first extract single important amino acid from the whole sequence, and then use the KSG (Key Segment Generation) algorithm to generate segments.
However, when the module uses a low exploration cofactor, a single amino acid can’t find another important amino acid to form a segment,
and they will be left isolated. Considering that an NLS segment must has a minimum length of 3,
we employ a random stretch on these single residues to form a segment; otherwise, these residues are ignored by our model.
The default value is no filter.
"Stretch prediction": Whether to stretch the segments in a predefined way. When using stretch, the model
further extends the recommendation segment to a predefined length with a certain probability. This stems
from our study that a residue or segment with high attention weight generated by A2KA not only indicates
themselves with a high probability being NLS, but also suggests that the area around them is also important.
Stretch segment may also introduce noise.
The default value is no strething.
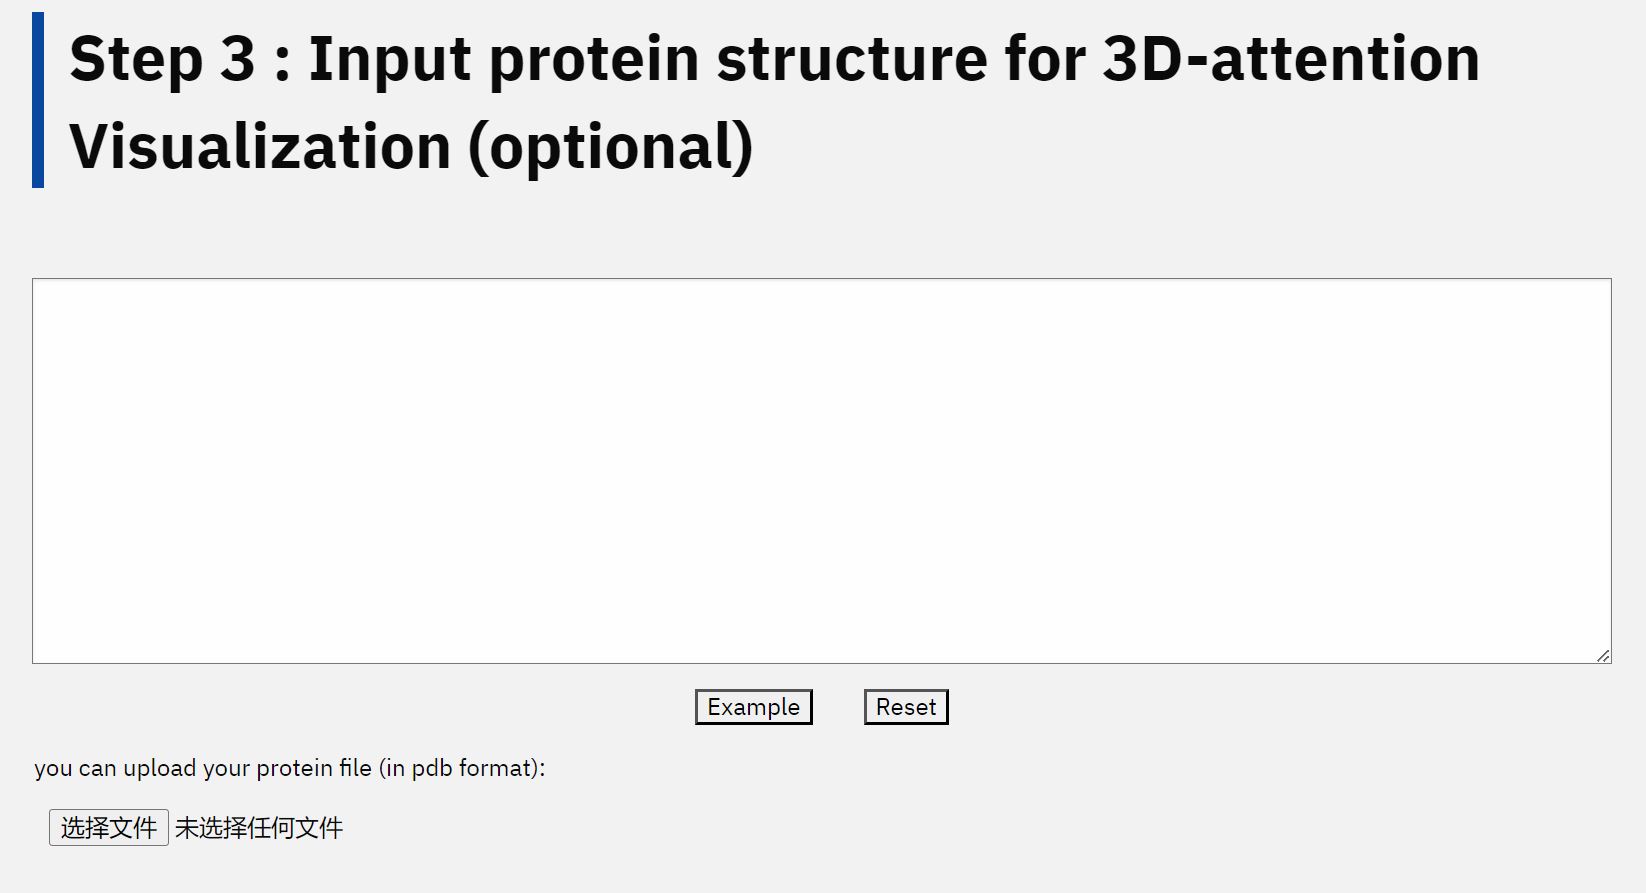
You can input a PDB file for the protein, and the structural statistics and attention distribution in the 3D structure will be displayed.
The calculation results from NLSExplorer will be sent to your email if you provide your email address.
NLS Candidate Library
The NLS Candidate Library stores all potential NLS segments identified by NLSExplorer. It was run with an exploration cofactor of 0.3, no filtering of single residues, and no stretch recommendation on all nuclear proteins with experimental evidence from Swiss-Prot. These parameters achieve approximately 1.0 recall for NLS and an optimal noise level for other segments in our test sets. Each point indicates a potential NLS segment detected by NLSExplorer. This map allows users to choose different threshold of possibility scores for display. Additionally, we provide a perspective oriented by species. Clicking the species bar in the upper left can show various kinds of species. Clicking show all will display data from all species. Showing all species takes about 20 seconds to load the data.
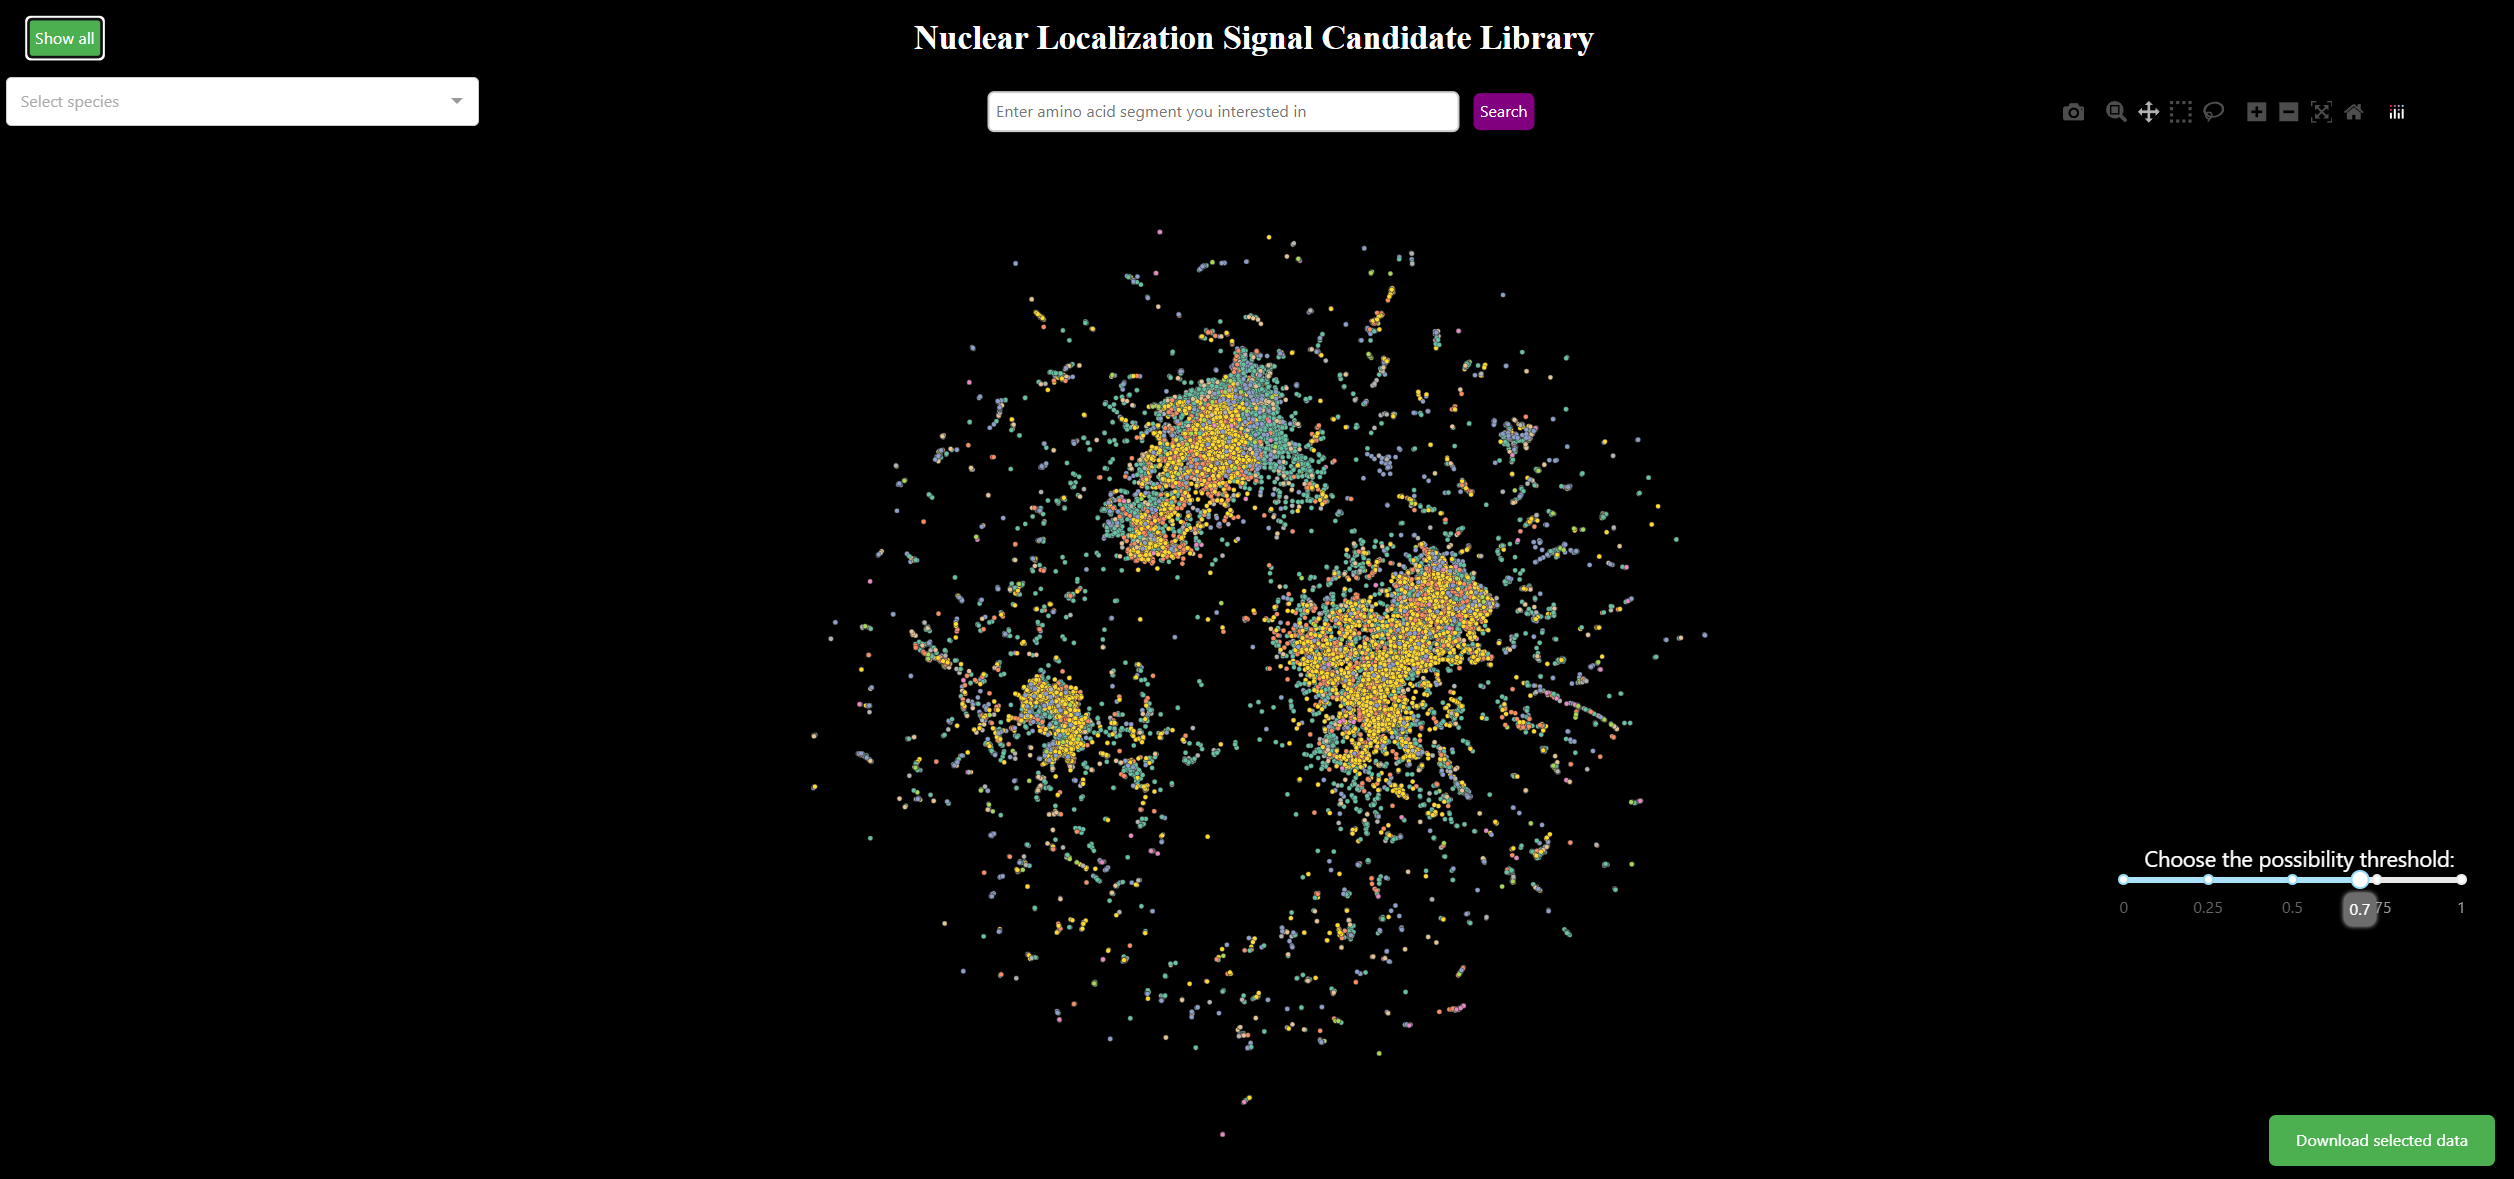
The NLS Candidate Library is an interactive map with a projection function. Users can display information about
points of interest by clicking on them. Moreover, the NLS Candidate Library provides two types of search functions:
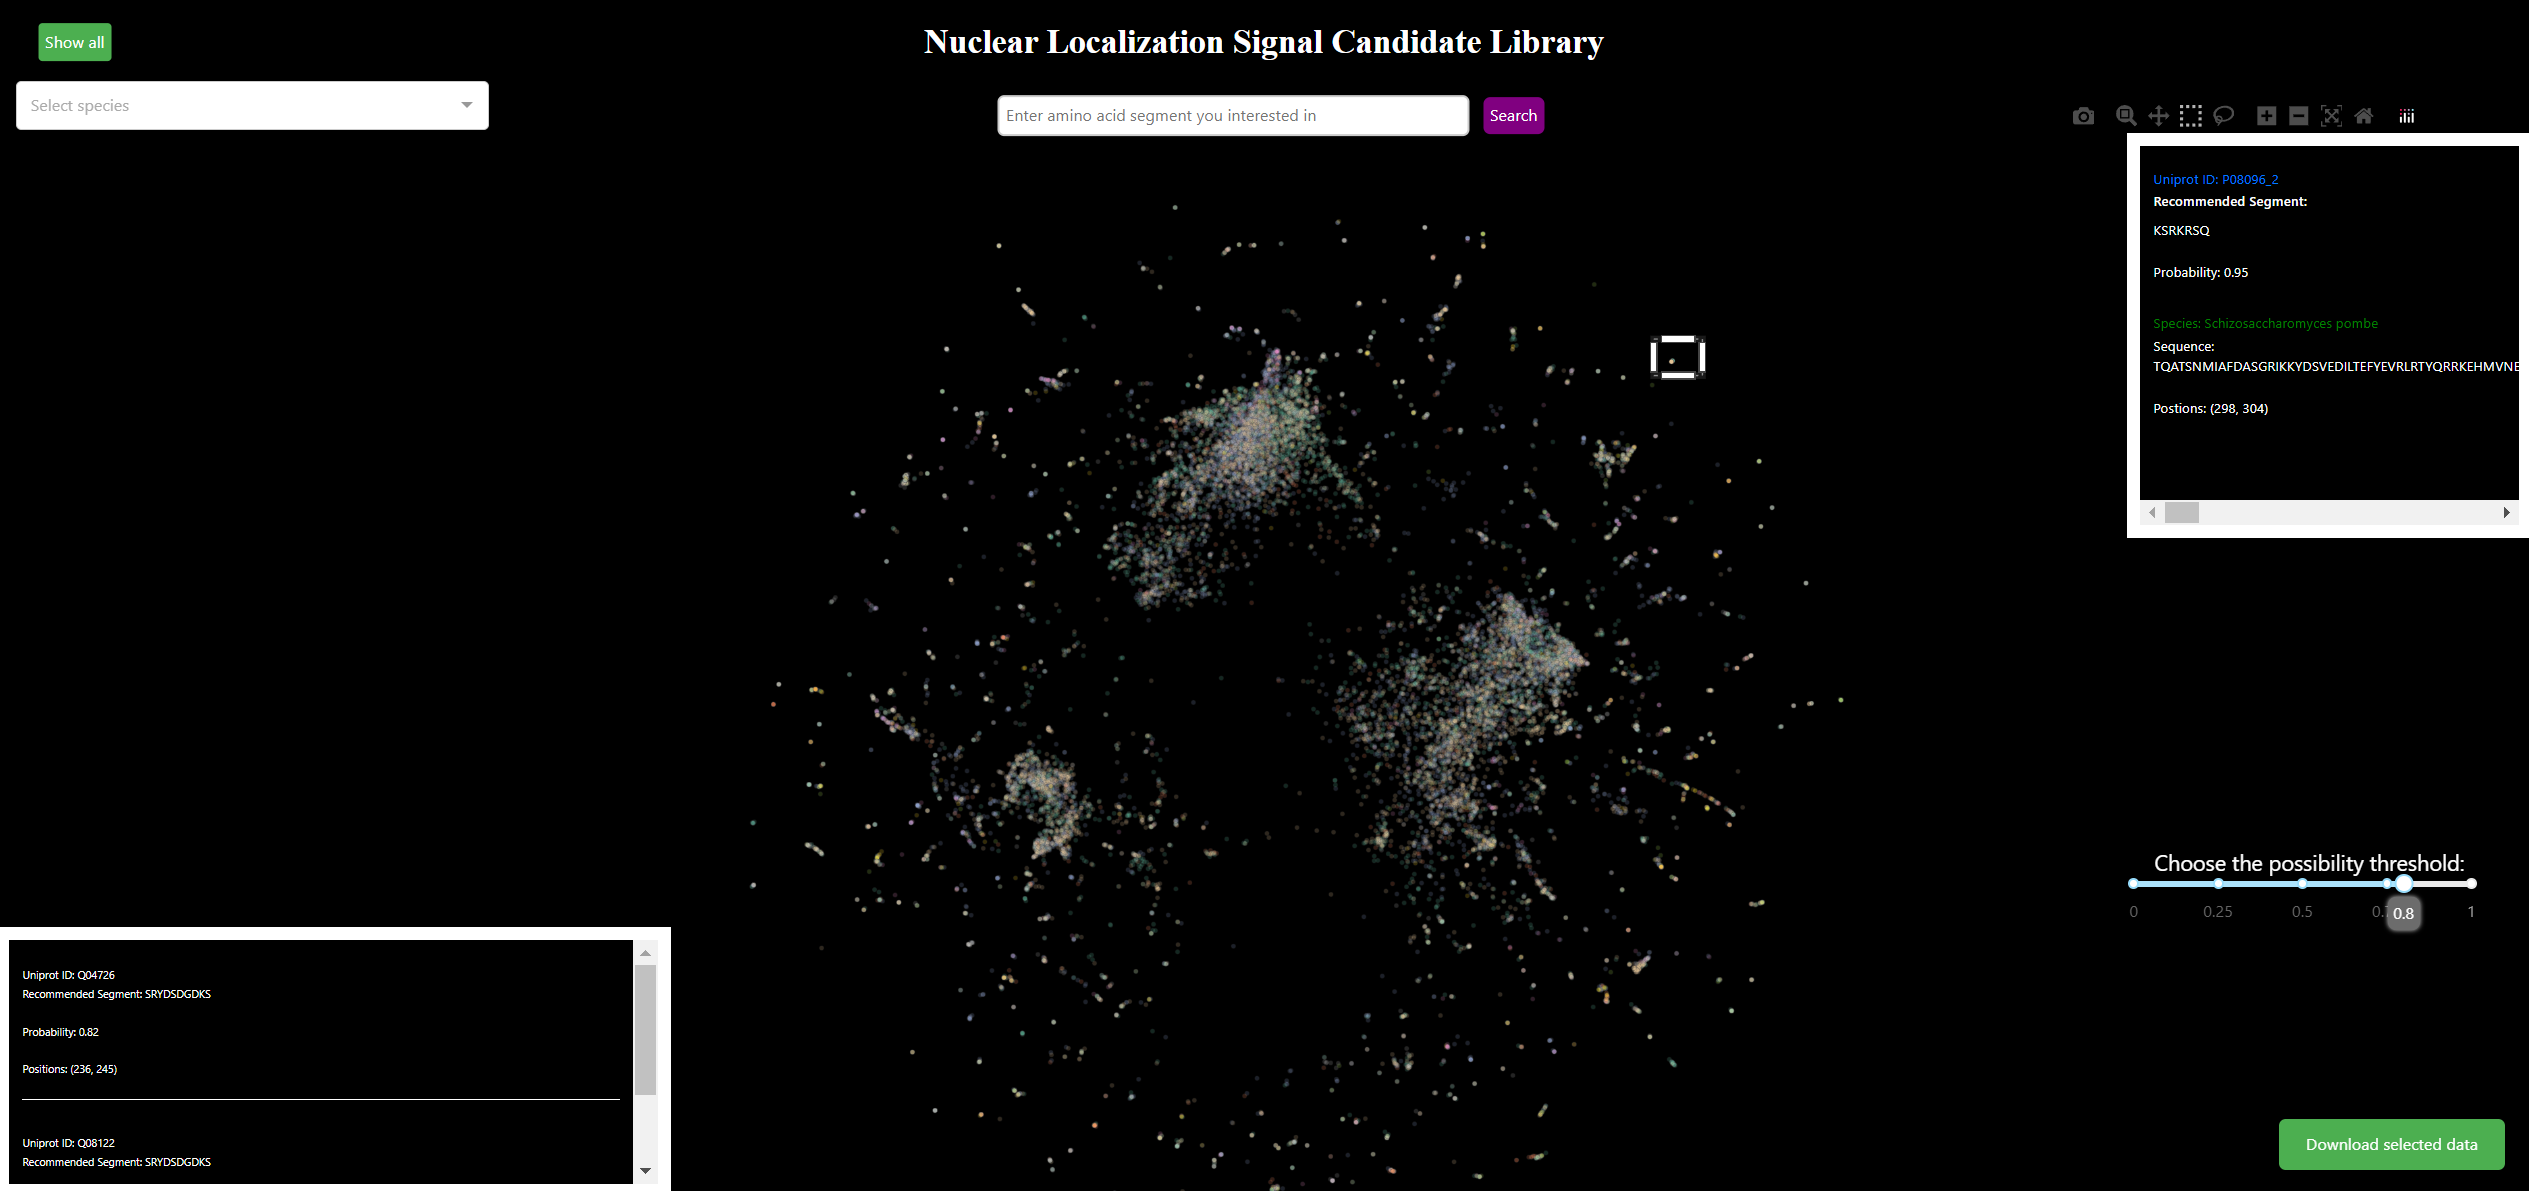
local search and global search. For local search, we offer box selection and lasso selection tools in the upper right.
The box selection tool allows users to draw a box to collect points, with all information about points within this box
displayed in the lower left. The lasso selection tool offers a versatile function, enabling users to define shapes to collect points.
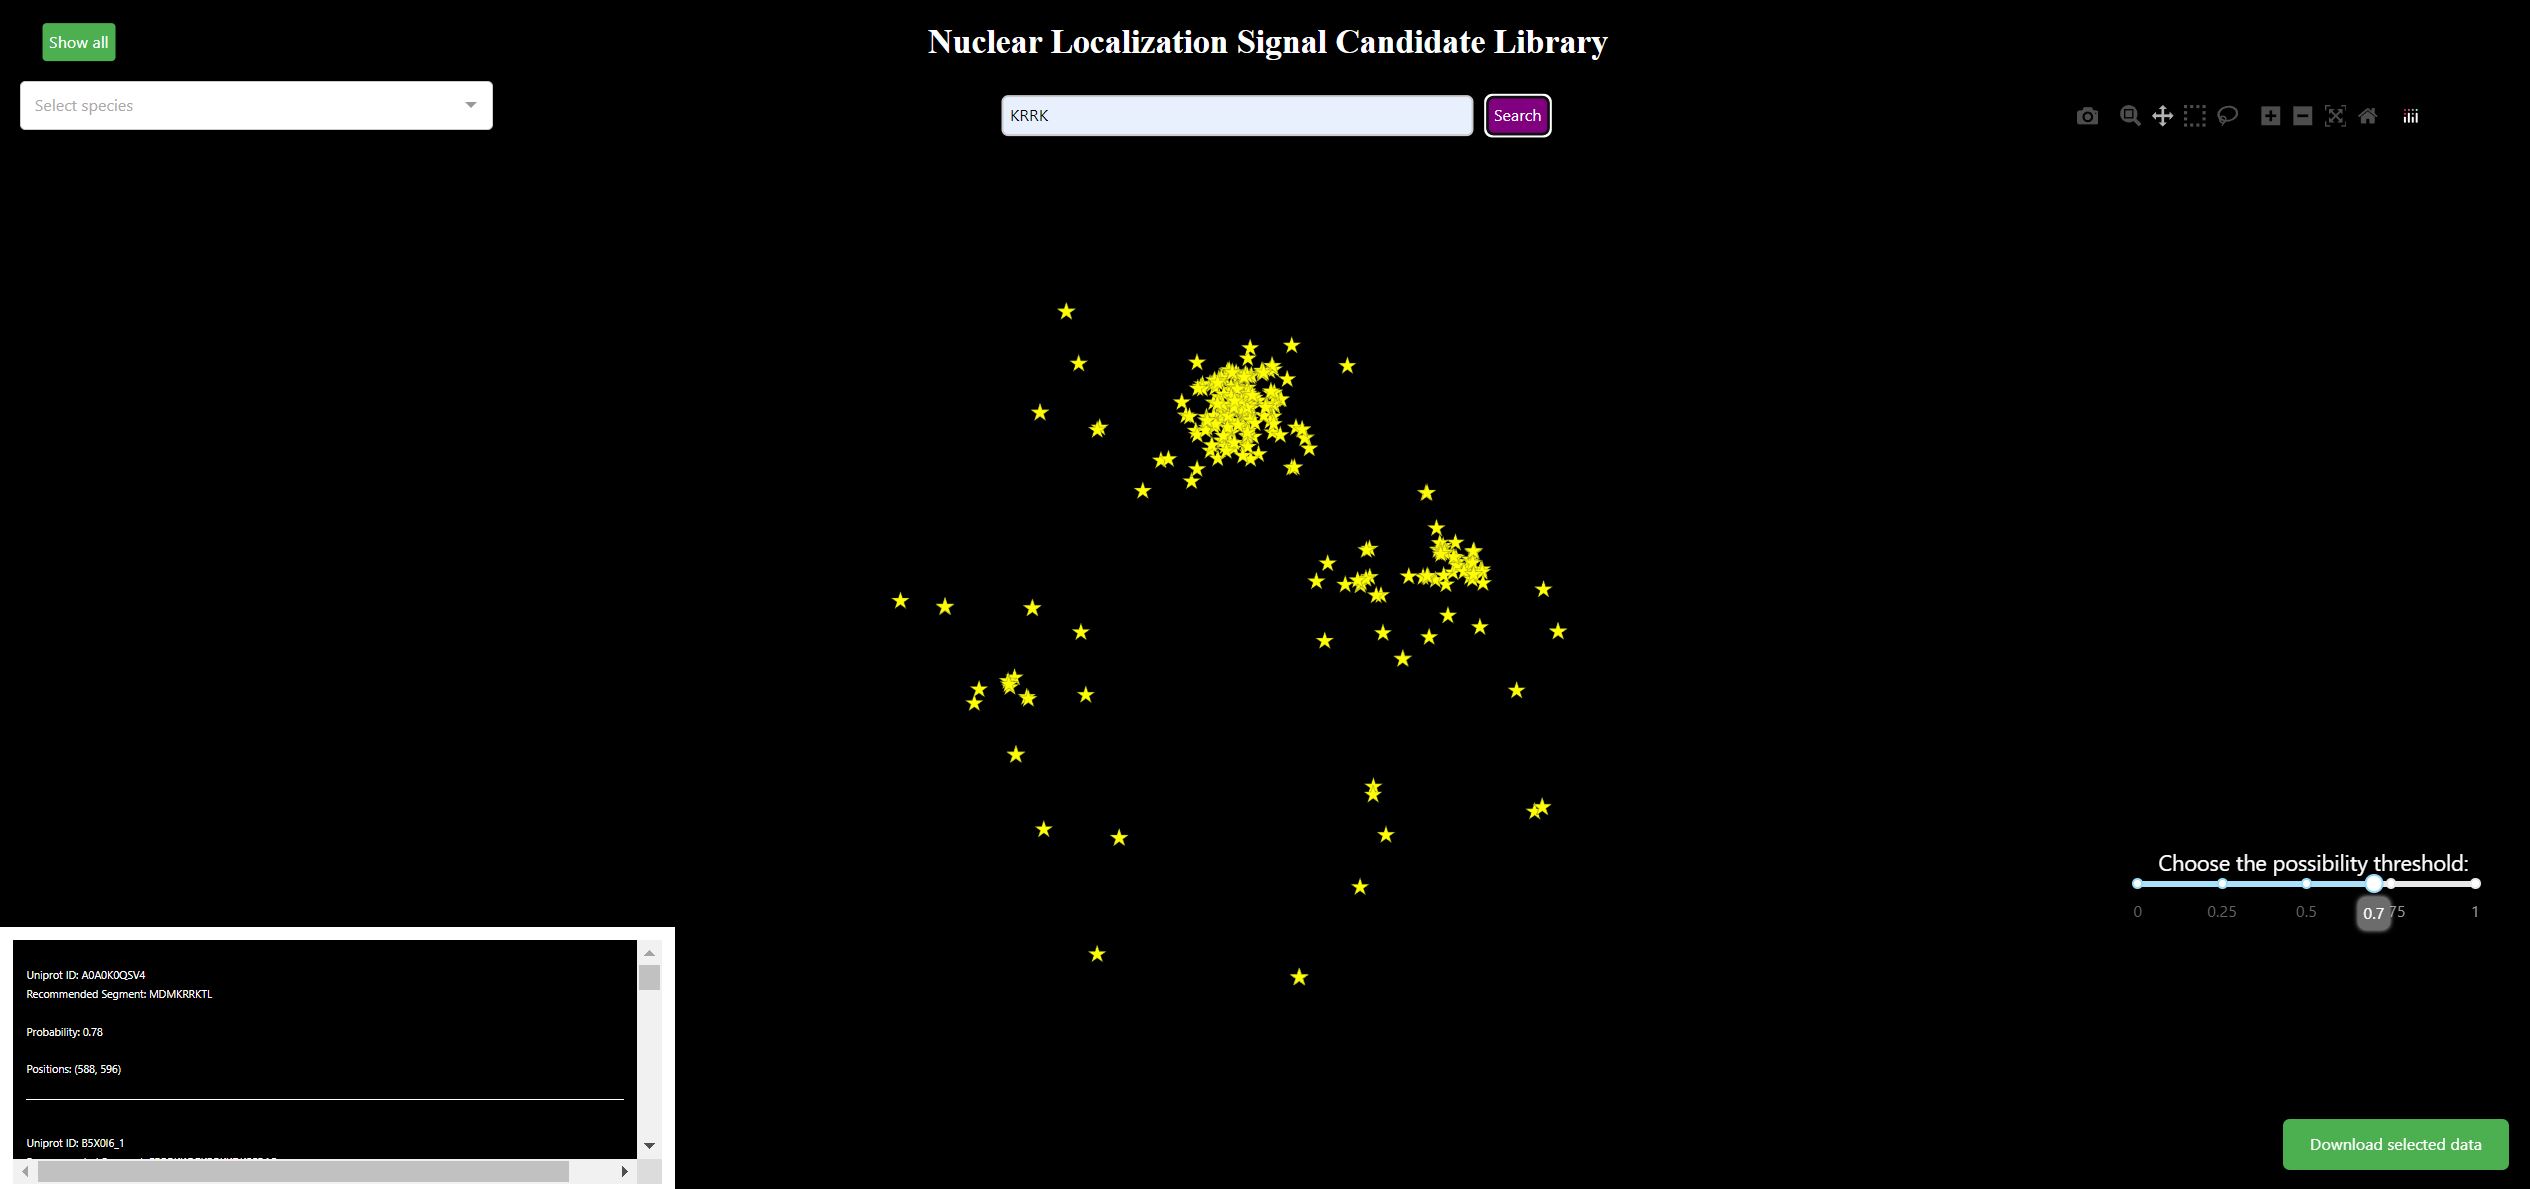
The global search function, also known as the projection function, allows users to input amino
acid segments of interest into the input box in the center. By clicking search, all potential segments of all species,
including the input segments, will be displayed on the map according to their assigned positions. In addition, if there are already points on the map, these points will be kept for comparison with the searched points. However, this may slow down the process if there are many points on the map.
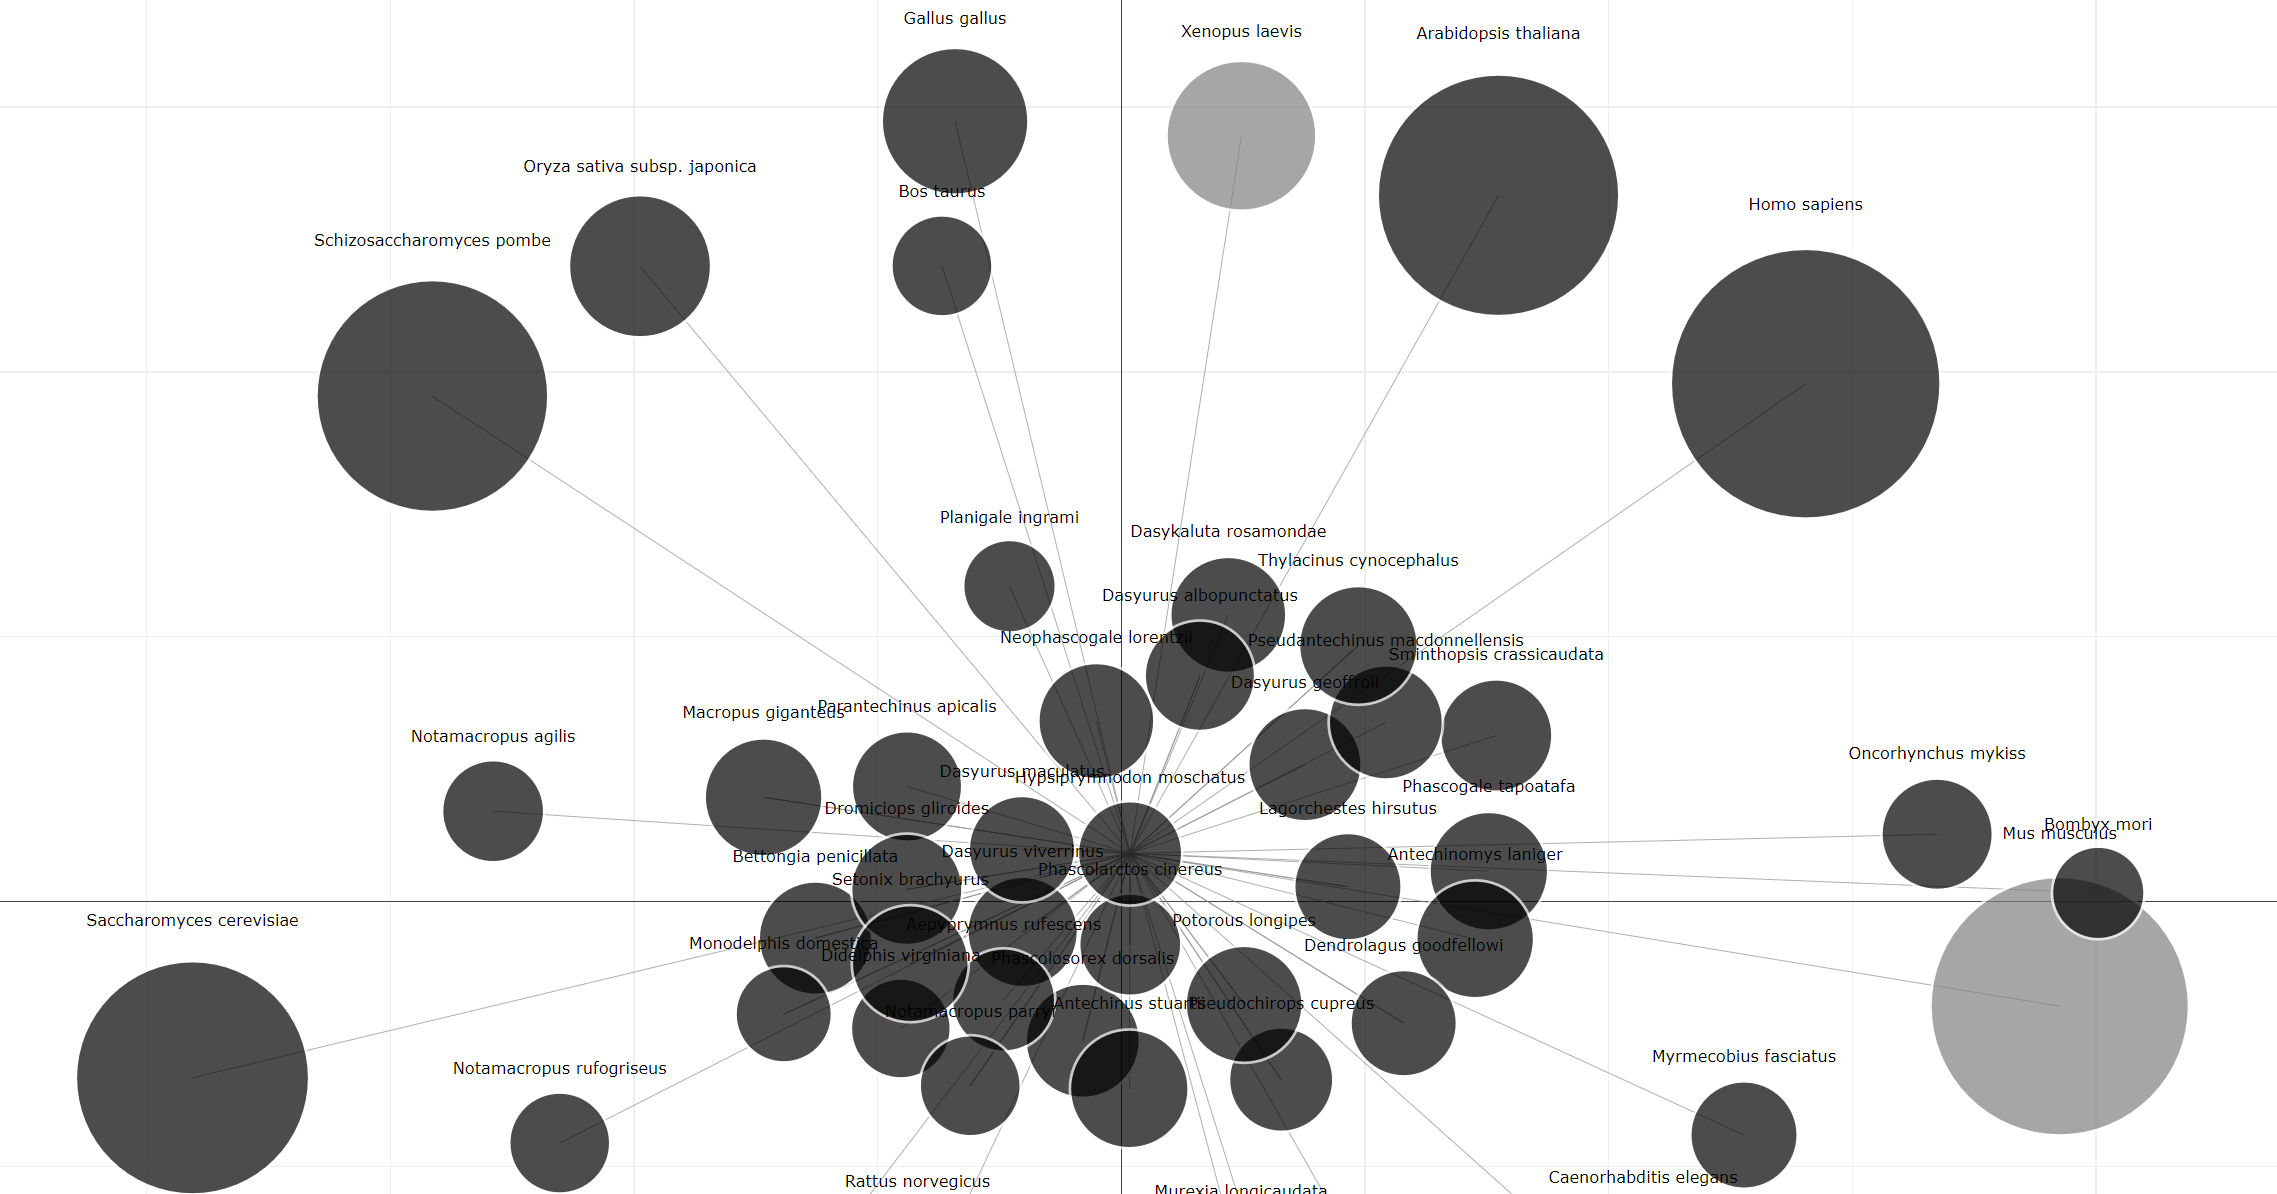
Interactive species map
We also provide a species map based on search correlation metrics. Species with an in-degree of more than 20 are included in our map. By clicking on a species, all species with a search correlation to it will be displayed, and the map will center on the selected species.