clustering enhancement of noisy cryo-em single particle images with new network structural similarity metric
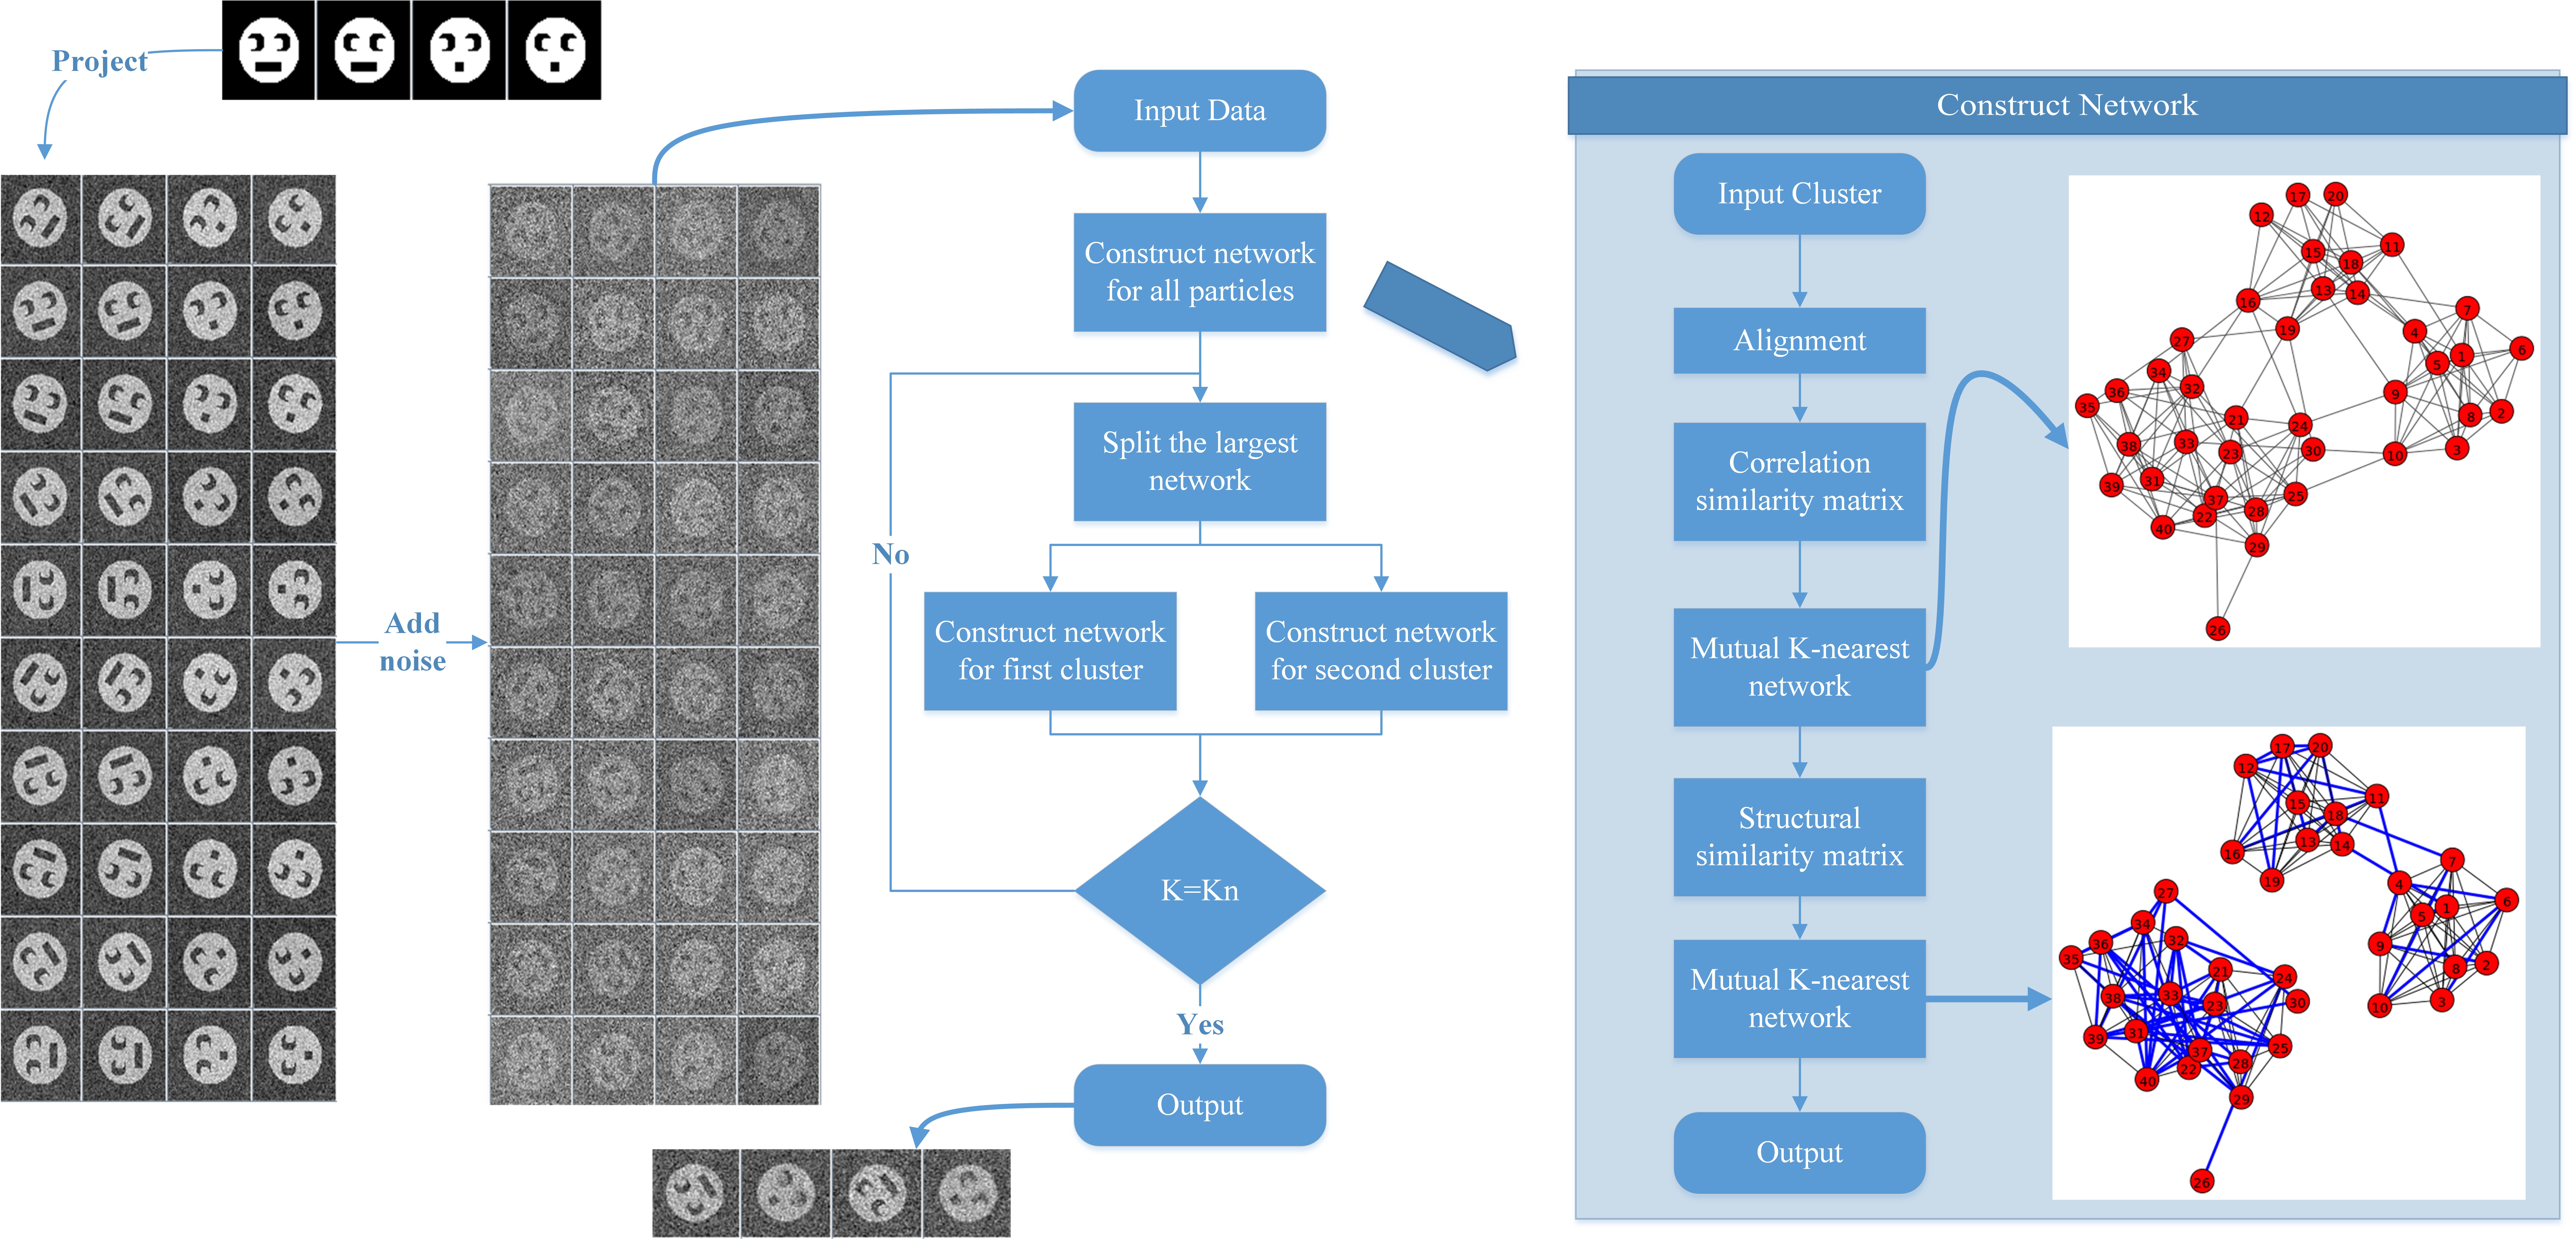
The flow chart of NCEM is shown in Figure 1.

Fig 1a. Flowchart of NCEM protocol. Left is experimental data generation procedure. Middle part is high level procedure of our algorithm while the right part is the detailed workflow of how to construct network for given cluster of images.

Fig 1b. A case study showing the difference of correlation-based similarity measurement and the network-based Jaccard refined similarity measurement.